Quantum Mechanics
Quantum Mechanics
This project started with one question: why do atomic orbitals have such specific shapes?
To find out, I rebuilt the hydrogen atom step by step, beginning with the radial wave function and ending with a full 3D model of the orbital. Debugging the final version took months, as I realized I had mixed up the real with some imaginary parts together. This forced me to understand the math with precision. When the model finally worked, the shapes matched the physics exactly. After using it in my chemistry class as a teaching aid, it showed me how visualizations can turn abstract ideas into something clear and intuitive.
Why this problem?
Quantum mechanics is often introduced as a list of shapes to memorize, disconnected from the logic that forms them.
I wanted to rebuild the system from the inside out—starting with the radial wave function, layering spherical harmonics, and ending with a full 3-D orbital.
It was an experiment in translation: could I make the invisible logic of the Schrödinger equation intuitive to anyone who moves a slider?
Problem Statement
How can I make quantum mechanics—normally buried in equations—visible, interactive, and teachable?
I wanted to show why atomic orbitals look the way they do, not just what they look like. The challenge was expressing the full hydrogen atom wave function in Desmos without simplifying the math, while keeping it stable, explorable, and accurate across all quantum states.
Collaborating with people (discord)
After I broke the 3-D orbital graph, I went to Discord for help. Nobody could figure out why the shapes kept collapsing or twisting.
It took months of trial, error, and late-night messages before I realized the issue wasn’t the math—it was me combining the complex and real spherical harmonics into a single function.
That mistake ended up being my best teacher. I finally understood what the complex wave function means physically, not just how to type it into Desmos.
Reflections
This project taught me that understanding begins when you can explain the logic visually.
Debugging complex functions forced me to understand what every sine, cosine, and exponential actually meant.
When I finally saw the orbitals form correctly in 3-D, it wasn’t just satisfying—it was proof that the math worked.
Teaching the same simulation later in my chemistry class made the learning loop complete: I built it to learn, then used it to teach.
Atomic Orbital Iterations
In eighth grade, I saw a picture of atomic orbitals that was nothing like the Bohr Model I’d learned in school. The shapes were so specific and symmetrical. When I watched Richard Behiel’s video on the hydrogen atom I was excited to learn that every curve and node was the product of an equation. I figured I could try plugging those equations into Desmos to rebuild those shapes from the ground up and see how math became matter. That curiosity launched my first true physics simulation.
Radial Wave Function
I wanted to see what really shapes an atom’s “probability cloud.” By visualizing the radial wave function of the Schrödinger equation, I showed how the wave function defines an electron’s distance from the nucleus.
This graph taught me to think like an experience designer because I built interactive sliders that would allow you to change the numbers and see the effect on the probability cloud. This was an important component to creating something that would help others better understand the equations by being able to play with them, without them having to rebuild the equations themselves. I have taken that experience and way of thinking into the rest of my projects.
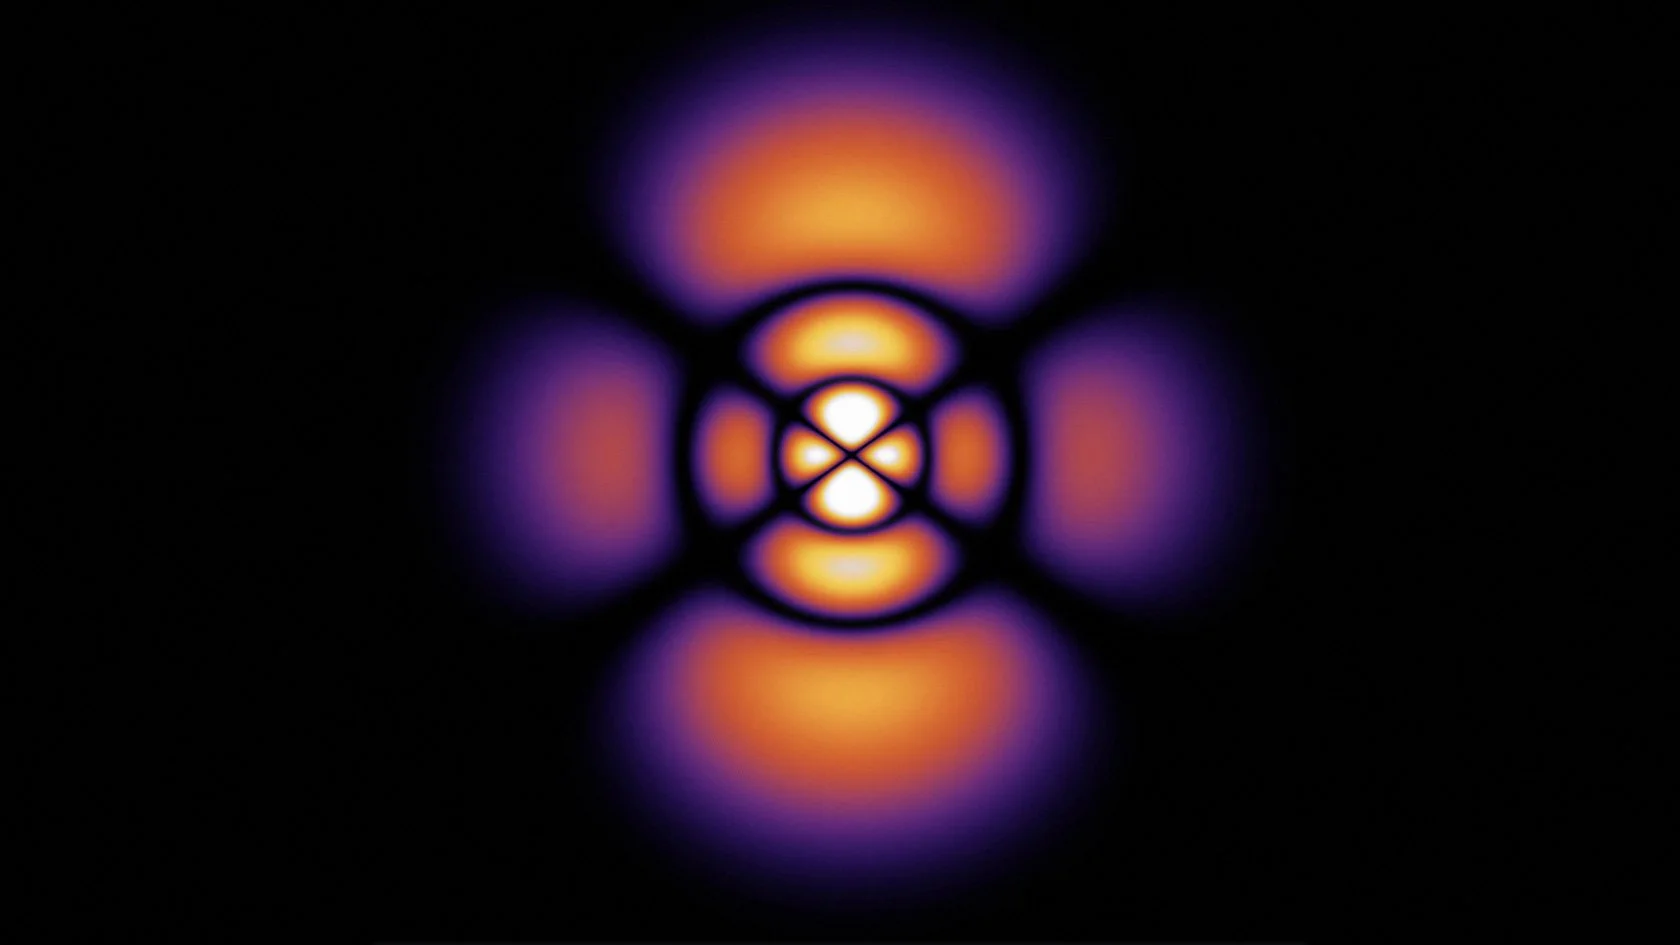
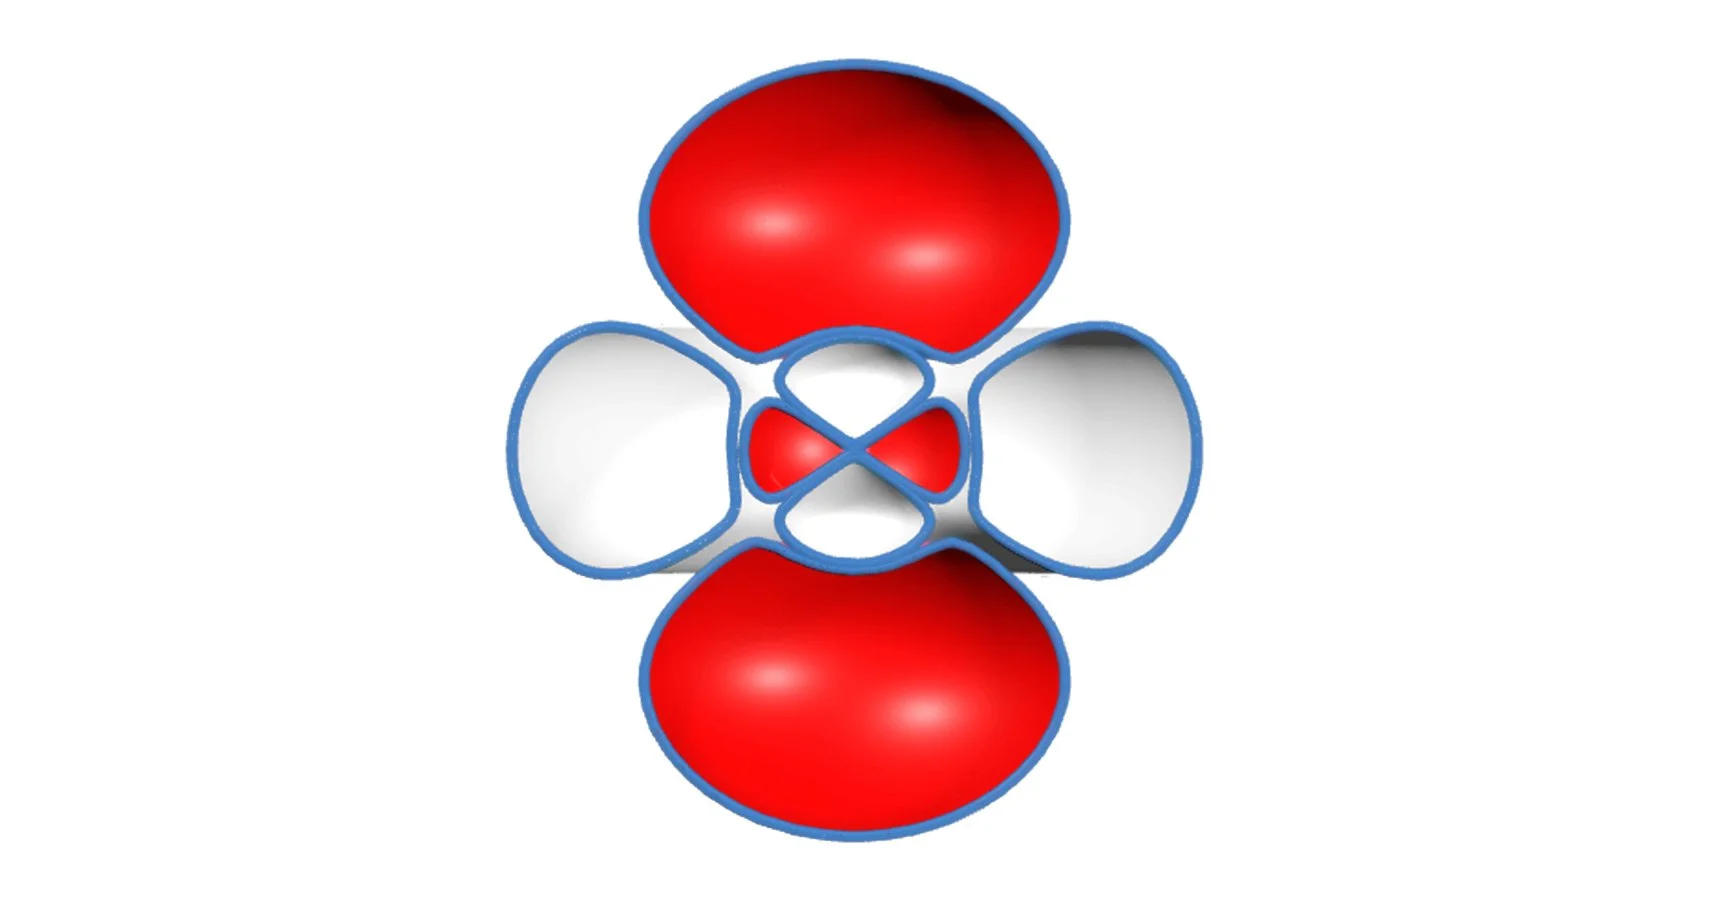
Spherical Harmonics
After finishing the radial wave function, I still didn’t understand why orbitals had distinct lobes and symmetries. Then I learned that spherical harmonics is what creates those shapes. I worked up a visualization to demonstrate how the quantum numbers l and m shape the electron cloud. I also wanted to see the symmetry in motion.
This experiment taught me organization and respect. I had to carefully organize every file, formula, and notation. If I didn't, and I had one thing out of place, or made one small error, it would completely reshape the graph. I learned to respect the precision of equations.
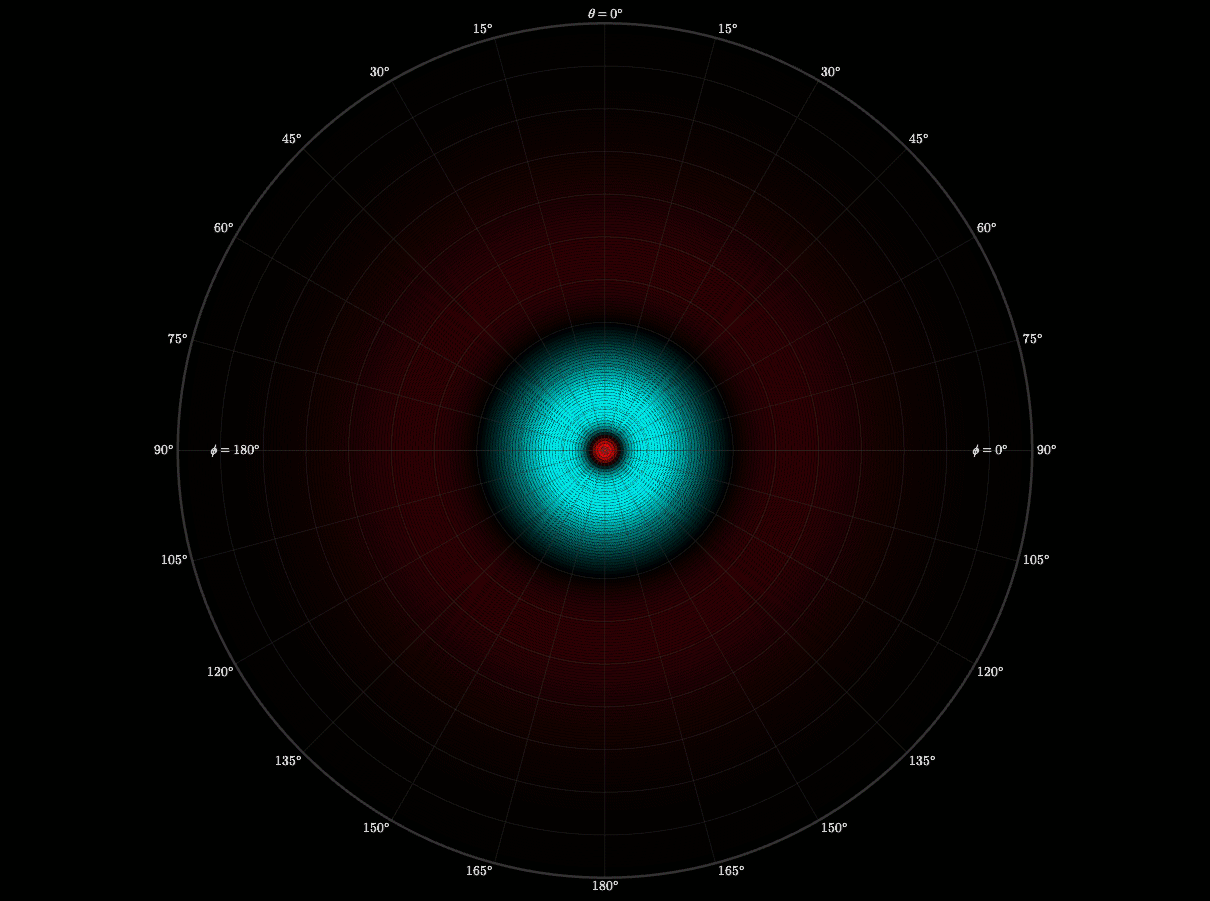
2D Atomic Orbital
After building the separate radial and angular pieces, I then wanted to see them interact. I built a 3D simulation that visualizes the probability density of hydrogen electron. I used colors and contours to bring it to life. Each contour was a boundary of probability. I felt like I was painting atoms with math!
This graph showed me how art, math and physics are complimentary. It was also when I began thinking like an engineer—testing cases, logging errors, and validating results until the visualization worked. I learned that persistence is critical for transforming curiosity into understanding.
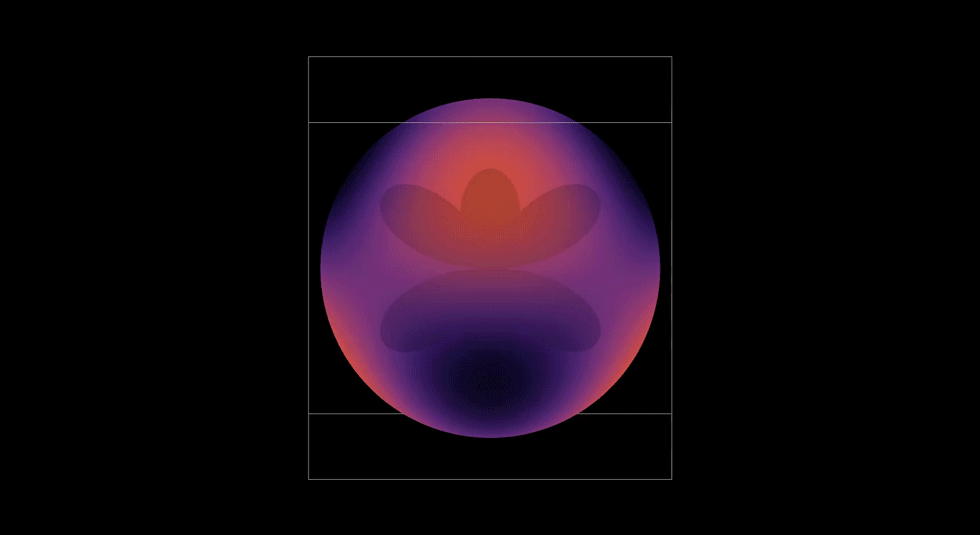
3D Atomic Orbital
This project brought everything together. It took the radial and angular components I had build out, the probability contours, and I even brought in the user controls with the sliders. Rendering it in 3D meant turning mathematics into geometry. It also gave me a chance to see via a simulation how an electron's wave moves through space and see how it might be possible to predict where an electron might be.
This graph showed me what mastery feels like. When it all came together and came to life, I felt like I not only understood the hydrogen atom, but I was deeply satisfied by how I developed my understanding. I took small steps through, making sure I understood each piece completely before bringing it all together. Yet, there was one more step in my learning path. I later used my simulation to teach my Honors Chemistry III class. Being able to teach others was a way to both challenge and demonstrate what I had learned. I loved it.
Quantum Experiments
The Quantum realm is fascinating to me. As I learn more about it’s different phenomena I want to experiment with visualizing aspects to help better understand them. The visualizations also help me have better conversations with my teachers, and classroom peers.
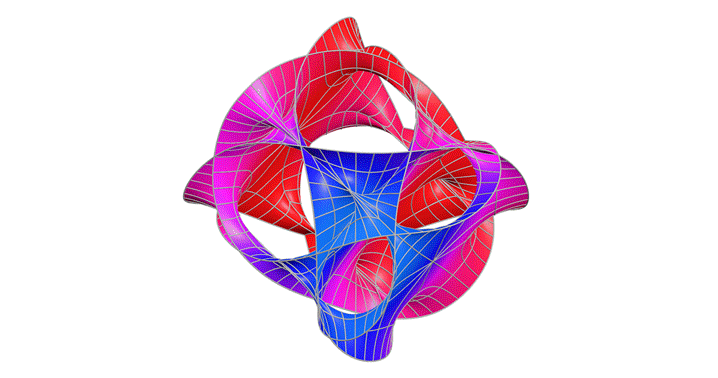
Calabi-Yau Manifold
After studying relativity and quantum mechanics, I wanted to go deeper into theories that try to unify them. One type of string theory says that there are 10 dimensions but we can only observe four. The Calabi–Yau manifold is a structure that allows those extra dimensions to fold in on themselves. This fascinated me and I wanted to see what it could look like.
This graph showed me that even the most abstract physics can be explored through visualization. I learned that I don’t need to solve everything to understand it; sometimes intuition comes through shape and symmetry. In the future, I’d like to add iridescent coloring to reflect the way these manifolds are imagined in real string theory renderings.
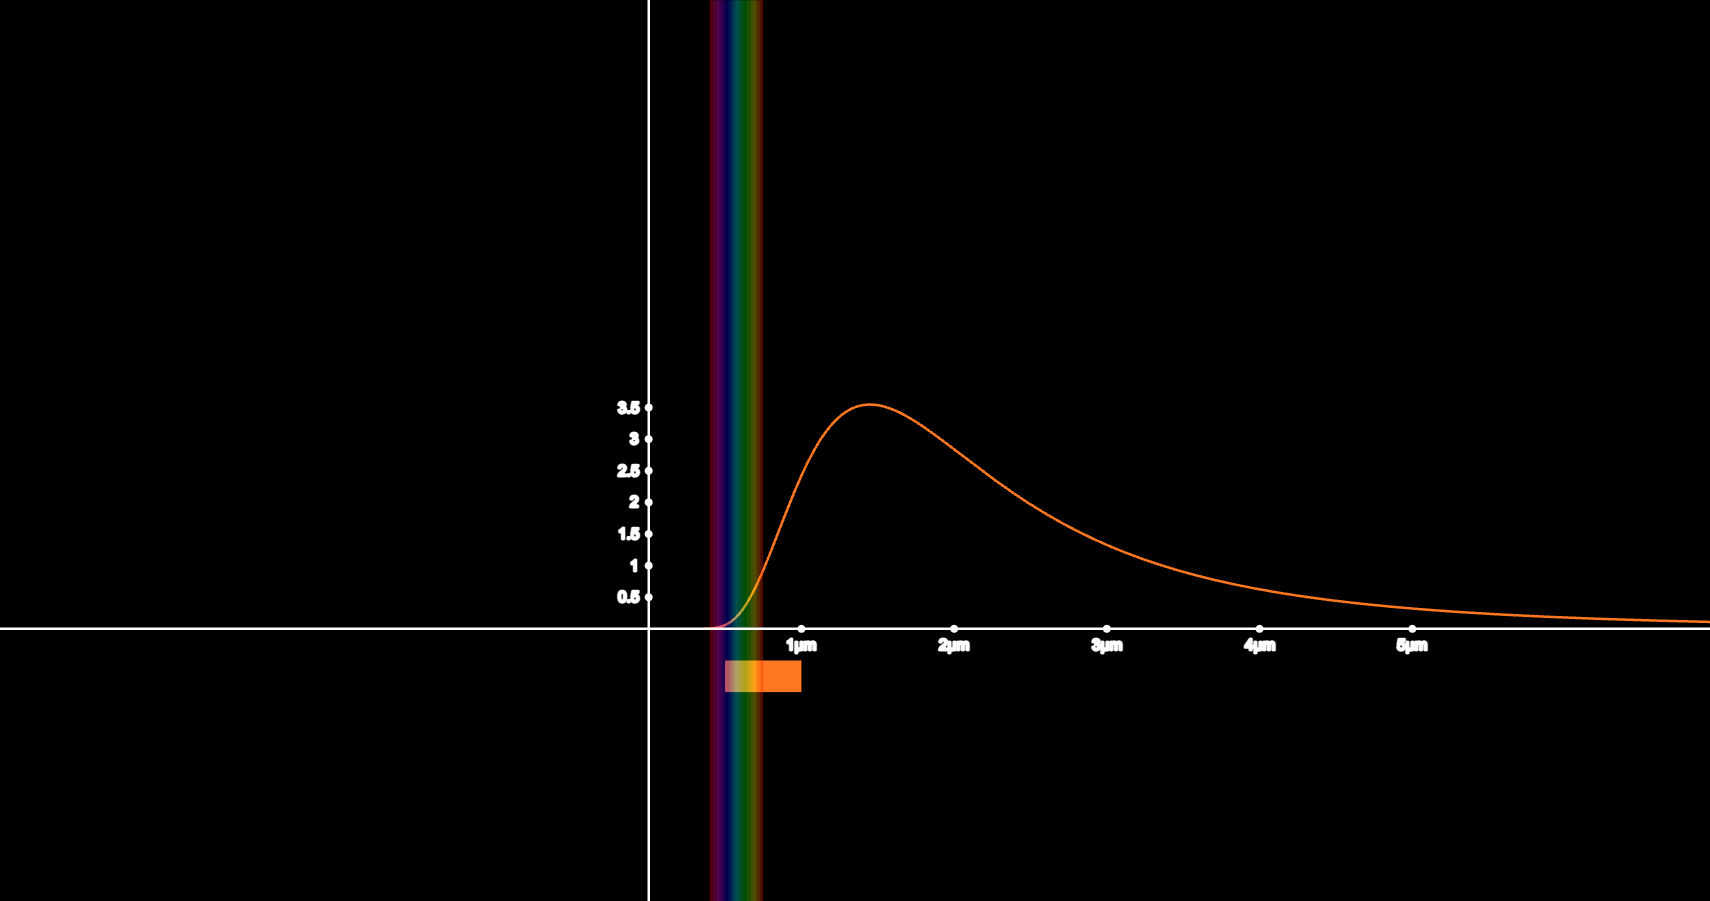
Black Body Radiation
I wanted to understand why hotter objects emit blue light. I decided to demonstrate it by creating something that would allow me to visualize the full black-body spectrum for any temperature. I had to build intensity curves, visible light wavelengths, and approximating the Planckian Locus to RGB.
This graph taught me the importance of building simulations that others can understand. As a teacher's assistant, I used this graph to teach a short quantum mechanics unit. My classmates were able to use my simulation to explore how Planck’s equation predicts stellar colors. The questions they asked helped me to later refine parts of my simulation, including changing some of the labels and sliders and improving the color precision. I realized through this experience that the best simulations don't just make complex ideas easier to understand, they invite questions.